K3D-jupyter
a powerful interactive 3D visualization for data science

About K3D
K3D-jupyter enables 3D visualization within Jupyter notebooks, the primary environment for data science and reproducible research workflows.
K3D-jupyter is an open source software package originally developed as part of the Horizon 2020 European Research Infrastructure project OpenDreamKit.
K3D remains under active development, currently under the patronage of Emphie Solutions.
The Challenge
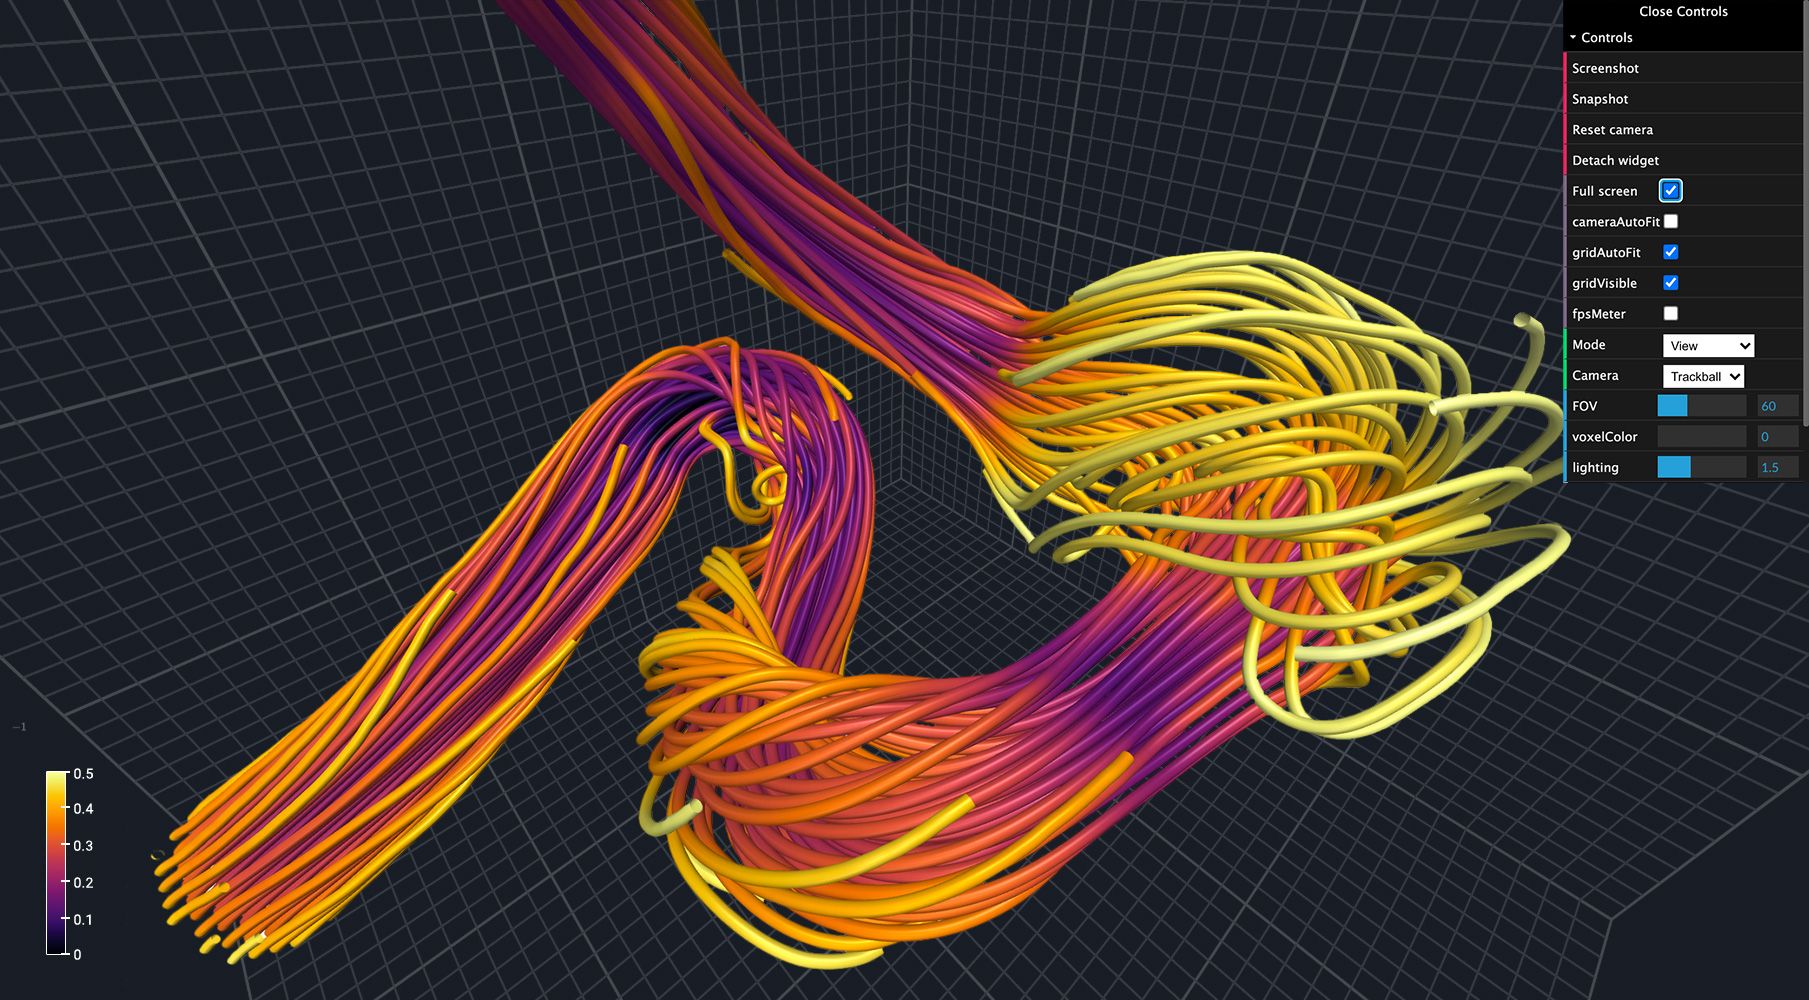
When working with 3D data, interactive visualization is key to building an understanding of the data. On a flat 2D screen spatial relationships only become fully clear when the 3D model can be navigated by the user.
Prior to K3D-jupyter, there was no convenient way to provide this kind of visualization within Jupyter. This was especially true for large datasets, difficult to visualize without hardware acceleration to visualize.
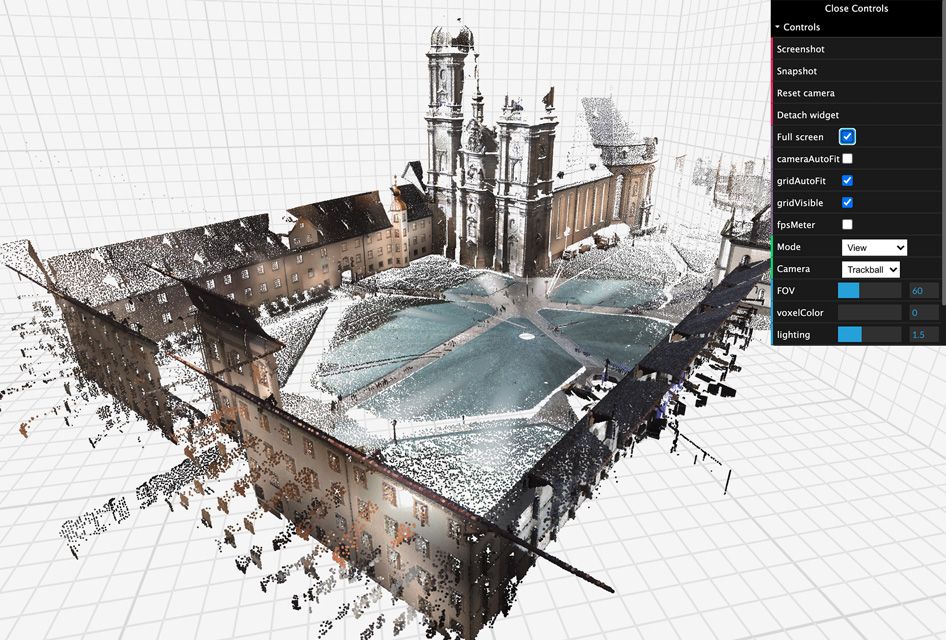
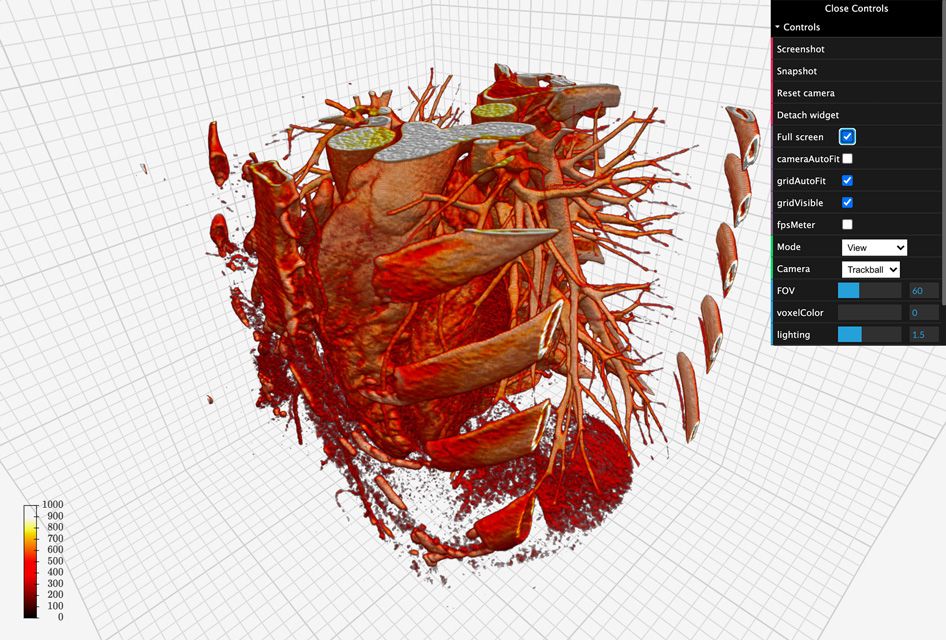
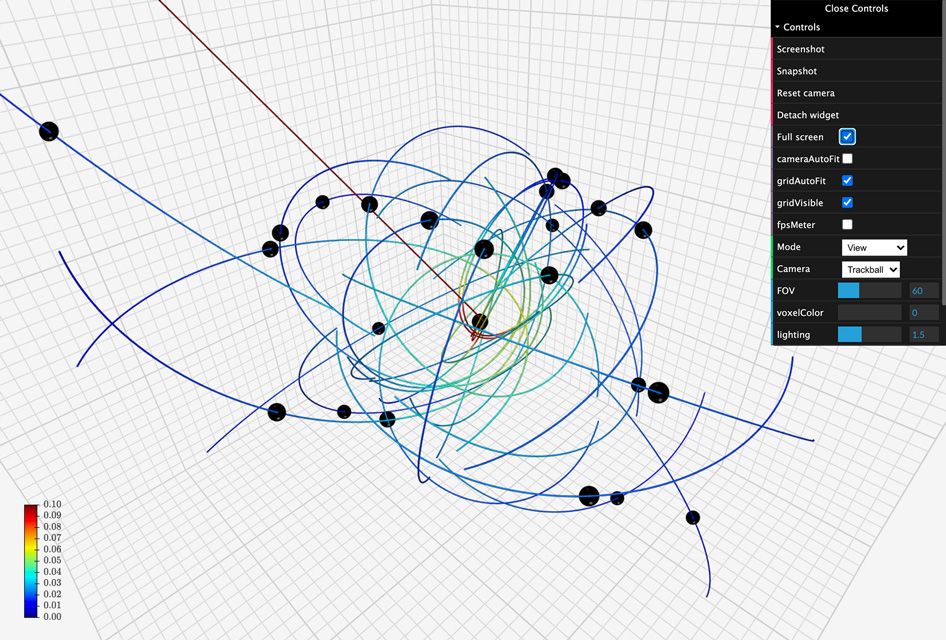
K3D lets developers create 3D plots backed by WebGL. It provides a high-level API based on surfaces, isosurfaces, voxels, meshes, cloud points, vtk objects, volume rendering, colormaps, etc. This ensures that 3D data can be visualized in an interactive manner, without any need for low level optimization typically required to achieve high performance.
K3D brings all this power to Jupyter notebooks, putting the power of 3D visualization under the fingertips of data scientists around the world. In addition, K3D can also easily be used as a standalone package like matplotlib, or in combination with other libraries such as VTK.
TECHNOLOGY STACK
Outcomes
on GitHub, and counting
Top Universities and Science Institutions
Downloads and counting
Next project
Marrodent
leading in dental supplies, thanks to tailor-made software

