Centralization of Docker container logs in the Amazon CloudWatch Logs service
While creating software, I strive to make the best use of application containerization and the capabilities of Amazon Web Services. Working in a containerized environment, especially on systems implemented using many cooperating containers, becomes much more pleasant when we apply additional tools that support this kind of development.
In this article, I would like to show you how to aggregate and centralize logs from applications running in Docker containers using one of those tools, Amazon CloudWatch Logs.
Docker Logs
Docker provides several built-in logic drivers. The basic and default one is the JSON File logging driver, which gathers all log messages that appear on the stdout and stderr streams into a JSON file.
To view those logs you can use the following built-in command:
$: docker logs [container id] --follow
When working on a single locally activated container this may be enough, but as you can easily imagine, things get tricky when working with more of them. Browsing all log files individually makes it very inconvenient and cumbersome to pinpoint sources of errors when they are not immediately clear, for instance when one of our containers incorrectly processes a message from the queue.
Docker itself is of great help here. It is able to redirect the stream of logs to a number of centralized logging systems and protocols:
We can choose to send logs to any of these logging solutions by making a simple configuration change - for all of our containers or only selected ones.
Amazon CloudWatch Logs
Amazon CloudWatch is a tool for monitoring resources. It helps in collecting metrics and logs, monitoring data (using dashboards with charts, counters, etc.), analyzing data, and setting up and managing alarms.
In my case, I used Amazon CloudWatch Logs service for storing grouped logs and CloudWatch Logs Insights for searching logs using its dedicated query language.
First things first, let me introduce you to the terminology and hierarchy:
- an Event - means an elementary piece of information, a single entry in the log,
- a Stream - is a set of events generated by one source, each container produces a separate stream,
- a Group - is a group of streams connected with each other - you can create groups in relation to the scheme
[PROJECT - RUNTIME ENVIRONMENT],eg.emphie-prod
We can configure log retention for each group of streams, to define a duration after which the logs will be automatically deleted (otherwise they are kept indefinitely). It is also useful to set up log exporting to the Amazon S3 mass storage service.
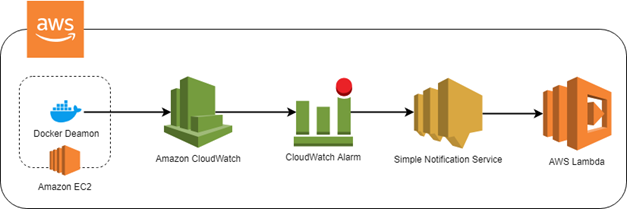
Another feature worth mentioning is the Metric Filter, which works as follows. A metric is calculated based on detected occurrences of defined patterns of terms, phrases, or values in incoming log events. Once the metric hits a configured level over a given period, alarms are triggered. A practical example could go like this: if within 5 minutes more than 10 fatal priority log events appear, send an email notification.

Email notifications are just one of the targets and can be replaced with, for example, triggering of an AWS Lambda function - which is the case I presented in the diagram above. In practice, a generated alarm may end up in any channel, e.g. as a message in Slack.
Test application
To test log handling within the containerized environment I prepared a simple Hello Api application. You can find the source code on GitHub.
The application provides a couple of endpoints (eg /fatal, /info, etc.), and logs information about the processed HTTP requests.
The implementation is based on the Fastify framework, which in turn uses the pino library to register logs. The purpose of the application is simple - redirect all logs to stdout and stderr.
To improve my work and maintain a certain standard, I follow two principles in my projects:
- all my log events are written in a uniform style based on JSON;
- individual log events are separated from each other using the same delimiter - no rocket science here, a newline character is enough.
In the case of Amazon CloudWatch Logs, the newline character allows you to immediately interpret each line as a separate log, and the JSON format is not only "pretty printed" but also decoded to a structure that can be searched relative to the selected field.
Container run
Before running the container, we must configure its access to AWS services. We can accomplish this using:
- environmental variables -
AWS_ACCESS_KEY_ID,AWS_SECRET_ACCESS_KEYandAWS_SESSION_TOKEN - A credentials file -
~/.aws/credentialsfor theroot - if the Docker daemon is running on the Amazon EC2 instance - by assigning the IAM Role (with access to the actions
logs:CreateLogStreamandlogs:PutLogEvents)
Running the container so that its logs get transferred to the Amazon CloudWatch Logs service requires providing several configuration options using --log-opt.
docker run --log-driver-awslogs \
  --log-opt awslogs-region=eu-west-1b \
  --log-opt awslogs-group=hello-api-service-group \
  --log-opt awslogs-stream=hello-api-service-stream \
  --log-opt awslogs-create-group=true \
  -i \
  -p 3000:3000 \
  devenv/hello-api:latest
The options work as follows:
--log-driver = awslogs- sets the Docker log driver for AWS--log-opt awslogs-region = eu-west-1b- sets the AWS Region--log-opt awslogs-group = hello-api-service-group- provides the group name--log-opt awslogs-stream = hello-api-service-stream- provides the name of the log stream--log-opt awslogs-create-group = true- allows for the creation of the group if it does not exist
In the case of an application that does not apply the practice of one log event = one row, you can change the log parsing behavior. To do this, create your own expression that will define the scope of one log and set awslogs-multiline-pattern.
After running the Hello Api test application container, we can send HTTP requests to it. All the log events it will generate are going to be propagated into the Amazon CloudWatch Logs service.
When inspecting the generated log events using the AWS CloudWatch Logs console, the first view is a list of all created groups:

From this level, we can access options related to group management, create metrics, and also export data to S3.
After clicking a specific group, we get a list of streams:

As I mentioned above, one stream contains log events from one Docker container. From this view, you can easily search the events in the group by clicking the Search Log Group button.
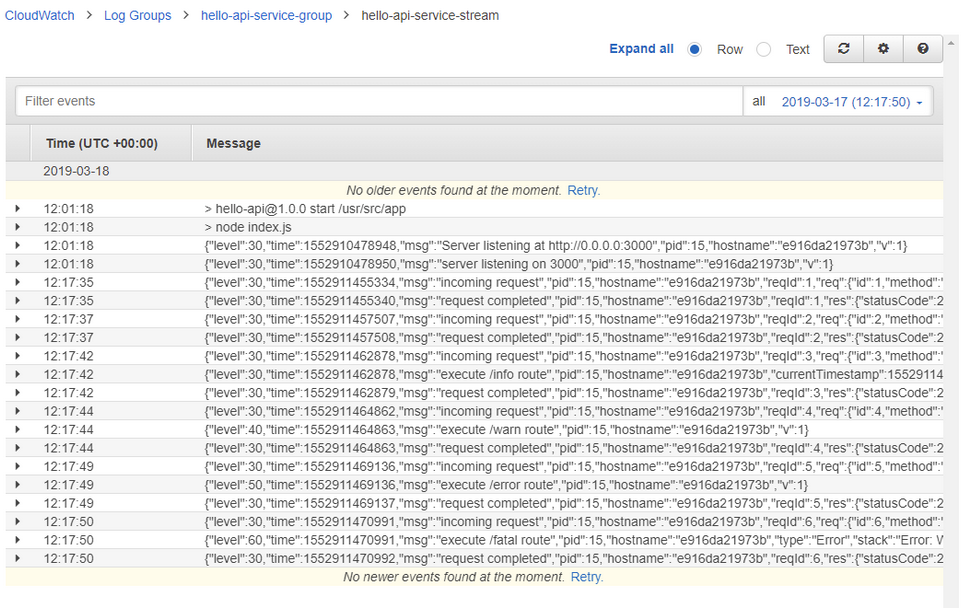
To go further you need to select an individual stream. After doing this, you will see a view with a simple search and a time range filter that presents the contents of the stream.

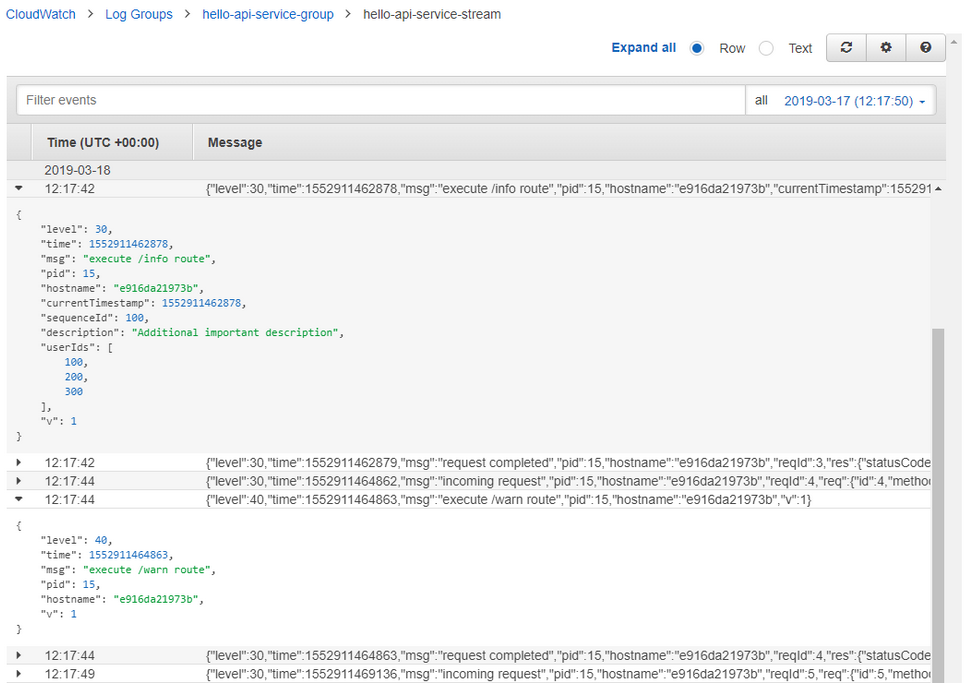
Details of individual events are already parsed and can be inspected in a nicely readable form:

What you see above is the log from the /info endpoint of the Hello Api application. As you’ll notice, I added a few fields to the entry to show that it’s easy to log custom data in addition to the standard msg value.
CloudWatch Logs Insights - Advanced search
A simple search is not always enough. In some cases, we need to search for values in a specific field, sort results, or extract only certain information from the log.
CloudWatch Logs Insights answers those needs by providing a dedicated query language that works in a similar way to SQL. It’s best to illustrate its use with an example. At one point I was interested in downloading log entries for errors with a priority of 60 (fatal), in reverse chronological order (so newest to oldest). The query to retrieve this data goes as follows:
fields @logStream, @message
filter level = 60
sort @timestamp desc
I also wanted to narrow down the search to one chosen group and one hour back in time. These conditions are specified using controls in the graphical interface.

Once the query runs, the results are presented as a list of log events, which can be inspected for details. The data is also visualized on a timeline graph.

Each of the entered queries can be pinned to the desktop in Amazon CloudWatch as a widget. This not only frees us from the need to manually query logs but also ensures that query results are presented alongside other metrics, on one view.
Summary
As you can see, the process of setting up a centralized log in Amazon CloudWatch Logs requires no more than a few simple steps.
Where to apply this?
I use this solution in all of my test environments. I configure the service to store log streams for 7 days and I only log entries with the priority I need. Consider using it in any environment where you no longer feel in control of the logs in your containers.
What are the benefits?
The primary benefits are a maintenance-free environment for collecting logs, fast search, and the ability to create metric filters that keep me informed via my preferred communication channels. It’s a complete solution out of the box.
Did I have to work hard to get it up and running?
No. All I had to do was to configure the container startup and make sure my application produced log output in the appropriate format. Once this was done, I repeated it for the rest of the system's applications.
That is how I do it. What does the organization of logs in your containerized applications look like?


